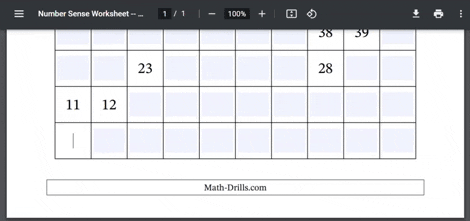
Recently, all of the 99, 100 and 120 charts on the Number Sense Worksheets page were updated. These types of charts are used for many purposes, but are often used for learning numbers and counting. After reading some compelling arguments about bottom-up counting charts, I made sure that each of the 99, 100 and 120 charts also had a bottom-up version.
Why count from the bottom-up, you ask? Essentially it is because we COUNT UP from lower to higher numbers, and there are many examples where the lower numbers are physically at the bottom and increase the further you go up: temperatures on thermometers, elevations of mountains, liquids filling a container, heights of students, y-scales on graphs (usually), floors in a building, etc.
Of course, the left-to-right, top-to-bottom versions are still available and might make sense depending on the activity, but if you’ve never tried the bottom-up charts, now you can!
As with many of the new worksheets I make these days, I made most of the charts fillable and savable. That means that students can complete the worksheets on the screen in their browser or using Adobe Reader; then they can save their work by downloading/saving their edited version.
The versions that are not fillable and savable are the charts that are already completely filled. Other than that, the blank, partially-filled, evens, odds, multiples charts can all be filled out on the screen without printing.
You’d rather print? Every chart is also printable and won’t show the light blue boxes when printed; they will look like they have always looked.
One last note: in the process of updating the 99, 100 and 120 charts, I noticed a number of old charts with different file names that were showing up on the search page. I’ve removed all of these to avoid confusion, but if you happen to have a link to one of these saved somewhere, you may have to update it.
Here are some quick links to get to the various charts: